Data-projects-with-R-and-GitHub
Project Description
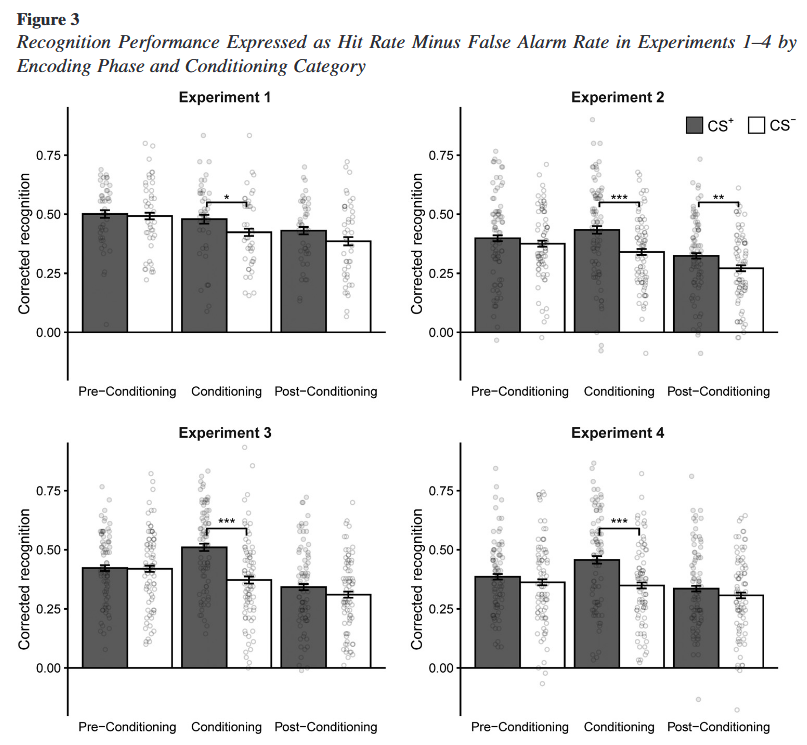
This project will use publicly available behavioral data from Kalbe & Schwabe (2022), which investigated how emotional experiences influence memory. To do so they looked at the memory performance of the participants, operationalised as corrected recognition. The unprocessed data can be found here, the preprocessed data which you will use, can be found in the folder project-data.
In the study participants were presented with a series of initially neutral stimuli. The presented stimuli were images of animals and tools. One category of images was paired with an aversive event (electric shock), while the other category was not. The category associated with the electric shock was categorized as CS*+ (conditioned category, CSm), the other category as *CS− (CSm).
The purpose of this pairing was to see if the association with the shock would affect the participants’ memory for the images. This kind of experimental design helps to understand hoe emotional experiences can influence memory.
About the Data
The preprocessed data are saved as .csv files. You can find a .csv file for each experiment separately in the above mentioned folder project-data.
Data for experiment 1, Data for experiment 2, Data for experiment 3, Data for experiment 4
Variables:
-
study_id - The number of the experiment
-
participant_id - The ID number of the participant
-
condition - The category of the item
-
Describes the item category
-
CSm - CS- category is the category which is not associated with the aversive event
-
CSp - CS+ category is the conditioned category, item category associated with aversive event
-
-
phase - The phase of the experiment during which the items were first presented
- conditioning - items that were first presented during conditioning phase
- post-conditioning - items that were first presented during post-conditioning phase
- pre-conditioning - items that were first presented during pre-conditioning phase
-
hit - Hit rate
- Proportion of previously seen images correctly classified as ‘old’
-
fa - False alarm rate
- Proportion of new images incorrectly classified as ‘old’
Data Manipulation
-
Read the data into your local R environment
- Read the files into R using the
read_csv()function from thereadrpackage, which is part of thetidyversepackage. Note: To avoid reading every file separately you can read them all at once. to do so you have to save the folders directory path as a variable. After that you can list and filter the .csv files. - If you pool the four experiments into one keep in mind that the participants IDs starts from 1 for each of the four experiments. If you simply merge the files into one, you will e.g. have participant no. 1 four times. To avoid this duplication a continuous count is needed.
- Read the files into R using the
-
Compute corrected recognition scores and save them as a new variable (e.g. “cr”)
-
Corrected recognition is computed by subtracting false alarms from hits. To do so you need the variables ‘hit’ and ‘fa’
-
Add the computed value as a new variable to the data table
-
Visualization
Your plotting task is to recreate Figure 3 of the original paper.

- Make sure that your data is in long format
- Create a grouped bar plot
- Map phase to the x-axis and corrected recognition to the y-axis
- The variable condition should fill the bars
- To create a multiple panel plot (faceting) you can use the
facet_gridorfacet_wrapfunction from theggplot2package. You can find the documantation here. - The legend (upper right corner) has superscripts. Try using the
argument
expressionto create superscripts. - Add individual data points over the bars
Optional
- add the p-values here you can find a link briefly explaining how to add p-values to ggplots
Here you can find the published paper from Kalbe & Schwabe (2022).