Data-projects-with-R-and-GitHub
General Topic
Mobile devices have become an essential part of our everyday life — being used for communication, information gathering, education, entertainment, and many more. It could even be argued that they have become too essential, with people spending many hours looking at their phones.
There are also many different models of mobile devices on the market with different functions, user-friendliness, and app support.
Consequently, the question arises if there are some models which are so well-designed that their users spend more time with them compared to other models.
The Dataset
The Dataset “Mobile Device Usage and User Behavior” has been published by Vala Khorasani on the data-community platform Kaggle. The dataset consists of only one .csv file with 10 attributes describing the device name, operating system, app usage time, etc. and a total of 700 observations.
To download the dataset directly from the website you would have to create an account. If you don’t want to do that, I’ve downloaded the dataset myself and stored it in my directory on GitHub. The directory can be found here
Still feel free to check out the dataset on Kaggle. It is located here. You can find further information about the dataset under the section Data Card.
Manipulation Goals
Luckily, the dataset is pretty straight-forward so there isn’t really anything that is not tidy. The only things you have to do are the following:
- Change the App Usage Time from min/day to hours/day
- For each Device Model compute the median App Usage Time
- Sum up the amount of users for each Device Model
Visualization Goals
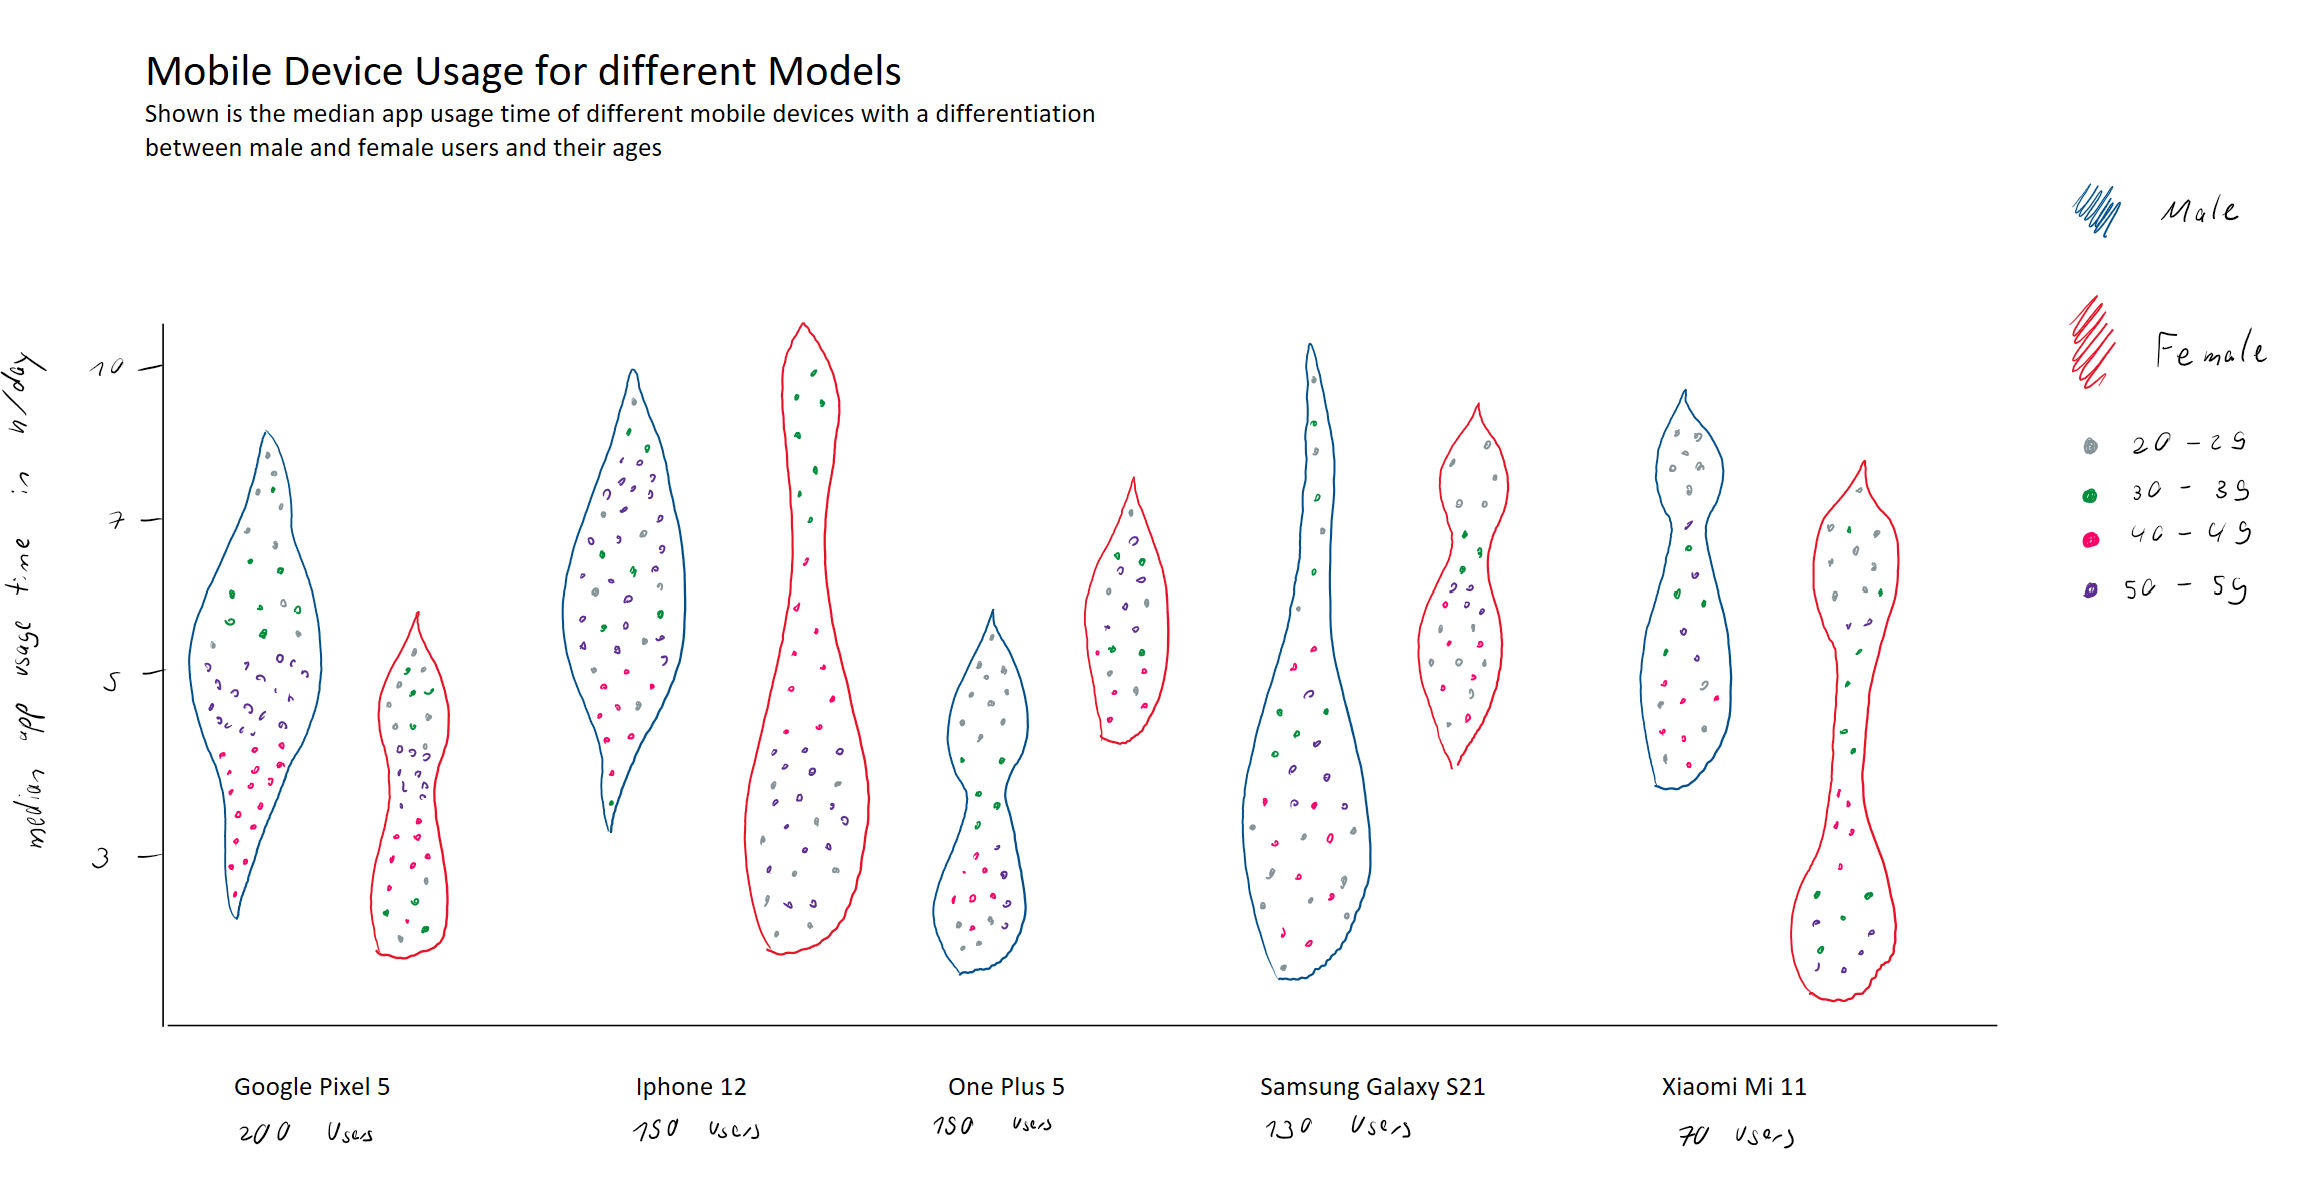
Try to visualize the data in such a way that it will more or less lead
to such a graph: 
Here a short list of visualization tasks:
- Violin chart for every Mobile Device Model and colored Gender
- colored scatter plot for the users age with color groups being 20-29, 30-39, 40-49 and 50-59
- arrange the charts with regards to the amount of users and show that number in the graph
- add title and legend for colors
It doesn’t have to be the exact same image I used, feel free to use something different.