Data-projects-with-R-and-GitHub
Topic: The impact of various deterrents on children’s consumption of sweets
A research group wishes to investigate how different Interventions effect children’s consumption of sweets. To this end, twenty children were monitored over six different time points. At each measurement point, the children were first given access to a selection of sweets (chocolate, gummy bears, biscuits, etc.). Subsequently, one of two interventions was carried out, designed to encourage a more mindful approach to sweets. Afterwards, the children’s level of self-control regarding sweets was assessed again.
As each child received both interventions during the course of the study, this constitutes a within-subject design.
The interventions:
Intervention 1: Reality Check discussions
The children had short conversations with teenagers and adults who spoke about their experiences of heavy sweet consumption.
Intervention 2: The Sugar Shock videos
The children watched short videos showing just how much sugar is actually contained in popular snacks and drinks. For example, sugar cubes were shown alongside soft drinks, muesli bars or chocolate bars to make the sugar content visible.
Note that each child received each intervention type three times in a randomized order. Thus, each child has in total six measurements (3 for each type). The order is irrelevant.
Data
You find the Data.xlsx in the Excel tabs “Intervention data” and “questionaire”
Quality index prior to the intervention The variables i1t0 to i5t0 capture five behavioural indicators prior to the intervention. Examples:
- reaches straight for sweets
- ask for sweets when hungry
- …
Coding: 0 = unfavourable behaviour 1 = favourable behaviour. The sum gives the quality index before the intervention e.g.: QIpre= i1t0+i2t0+i3t0+i4t0+i5t0 and can reach a value betwenn 0 and 5. (0, if behaviour is not favourable and 5, if behavior is favourable)
Quality index following the intervention: Variables i1 to i5 measure the same behavioural indicators following the intervention. The sum gives the quality index after the intervention.
Motivation and Helpfulness: After each intervention, the children answered two questions: “How motivated were you to eat fewer sweets?” Scale: 1 = not at all motivated 4 = very motivated “How helpful did you find the method?” Scale: 1 = not at all helpful 4 = very helpful The aim is to investigate whether the children’s motivation explains why one intervention is more effective than the other. Intervention → Motivation/Helpfulness → ΔQI
Childrens age: You can find the age in the second table “questionnaire”).
Generall attitude: Childrens general attitude towards sweets was measured with 4 items (sweet1-sweet4) on a 4-point scale. The mean of these items gives the general attitude towards sweets (Attitude).
Tasks
-
Read the data into R and prepare it for analysis.
-
You need to calculate a sum score for the quality index before and after the intervention. Create two new variables, QIpre (the quality index before the intervention) and QIpost (the quality index after the intervention), that represent the quality index before and after the intervention, respectively.
-
Calculate a mean for sweet 1-4 and merge the new variable together with the childrens age to the other tabel, so that you have one dataset in total.
-
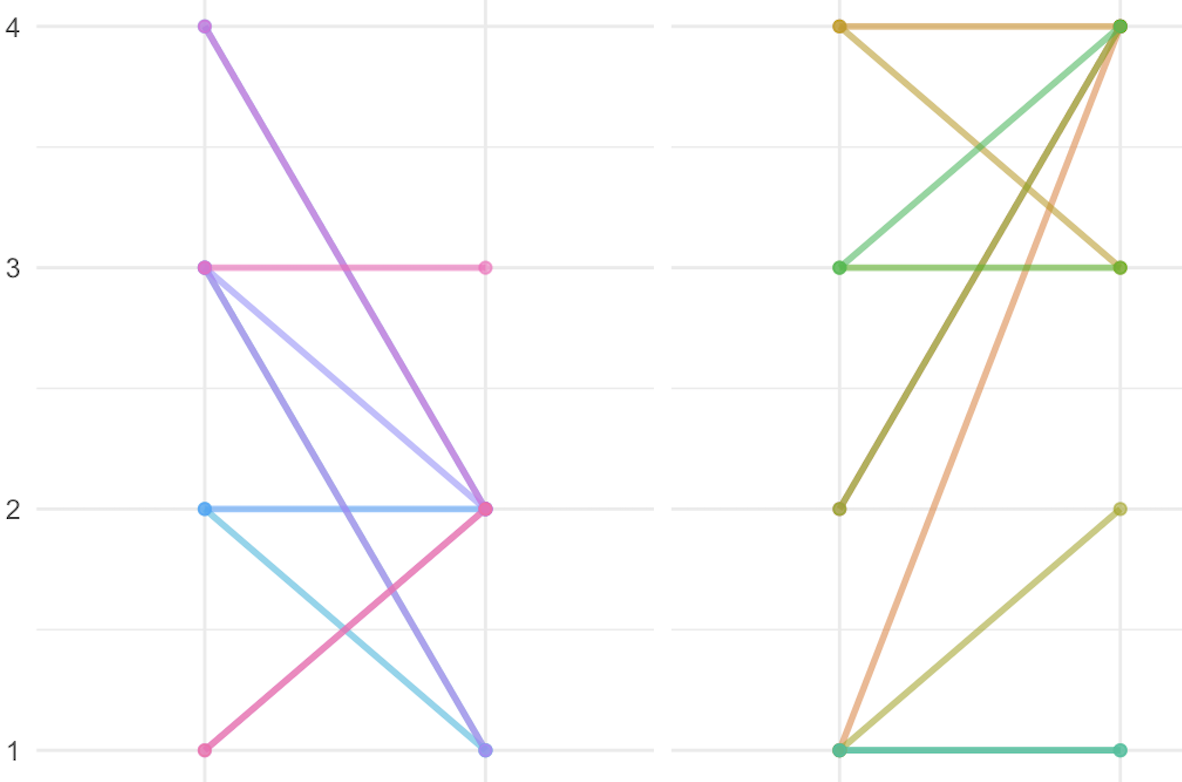
Compare the two interventions in terms of their effect on the increase in quality visualy. Plot the individual changes in behavior before and after the two Interventions across the conditions. Therefore each panel shows a simple two-pint line (a connected dot plot) where each line represents one participant, connecting their pre score to post score. The panels should be titled “Reality Check” and “Sugar Shock”. Both titles must appear centered above each panel. The two panels can share the same x- and y-axis, but each panel contains its own set of lines. Name the x-axis “Intervention type” (with two categorial positions; Quality Index Pre and Quality Index Post) and the y-axis “Behavioral Indicator” (Numeric scale 0-5; tick marks 0,1,2,3,4,5). In order to manage overplotting, the line thickness or colour should be scaled according to the frequency of the line. Get inspiration here:
-
Test whether motivation moderates the relationship between the intervention and the QIpost in quality (for each type) and control for the initial QIpre. In statistics, moderation happens when a third variable changes the strength or direction of the relationship between two other variables (predictor and outcome). In our case the predictor is the Intervention type, the Outcome would be QIpost and the moderator is the motivation. To calculate a Moderation in R use an interaction term within the LMM: model2 <- lmer(QIpost ~ intervention_type * motivaton + QIpre, data = data)
-
To plot the moderation of task 6, use a linear plot with the motivation on the x-Axis, QIpost quality on the y-axis and one line (colour) for each Intervention type. It should look like an interaction plot in the end.