Data-projects-with-R-and-GitHub
Crops vs. Climate
Climate change is a huge challenge for farmers worldwide. It is causing extreme weather events, such as droughts and floods, which can have devastating effects on crops and livestock. This project focuses on crop production in the region of Tübingen and how it has been affected by climate change.
Data Sets
Crop Production Data
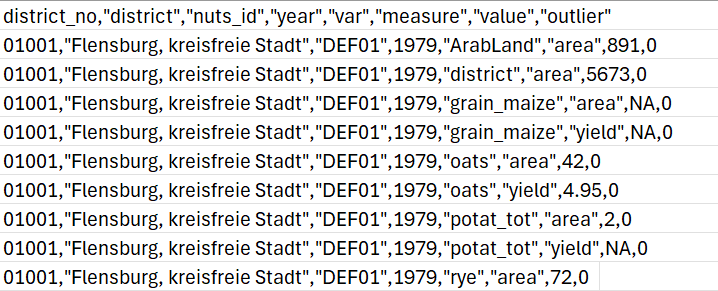
The accompanying documentation (PDF) offers a thorough explanation of the dataset’s structure, including column descriptions, units of measurement, and crop classifications. The dataset itself is available as a CSV file.
Description: This dataset contains information on crop yields and area in Germany from 1979 to 2021 at a harmonized district-level. It includes data on various crops, such as wheat, barley, and maize, including their yield (in tons per hectare) and the harvested area (in hectares). We are interested in the crop yields in the district of Tübingen.
Climate Data
Source: Deutscher Wetterdienst (2023)
Description: The Deutscher Wetterdienst (DWD) provides a wide range of annual climate data, covering key variables such as mean air temperature, precipitation, and frost days. These datasets are found under category 4: Average values for the individual federal states and for Germany as a whole, specifically within the “annual” directory:
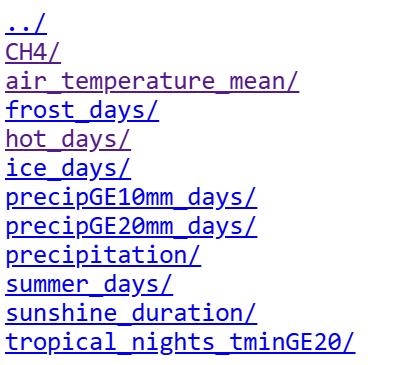
The datasets are provided as text files (.txt) within their respective directories. Users can download them easily by right-clicking and selecting “Save link as…”
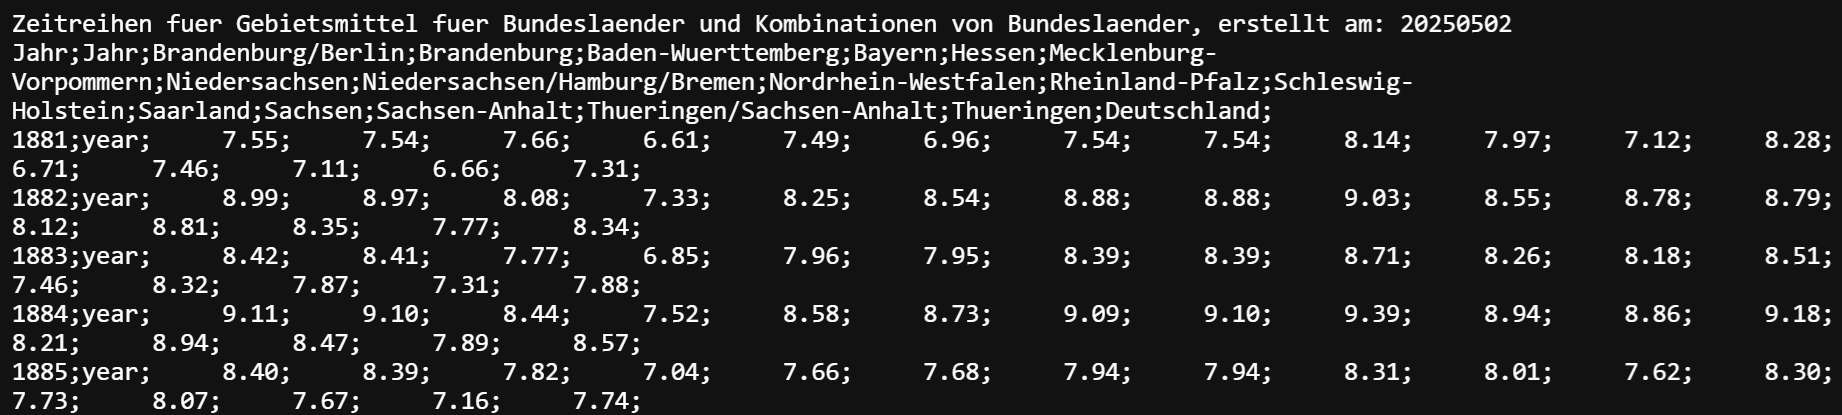
The data is organized in table format, where each row corresponds to a year and each column represents the value of a specific climate variable (e.g., mean air temperature) for each federal state of Germany. Detailed information about each variable, including units of measurement, is available in the accompanying documentation within the respective directory.
For our analysis, we focus on the climate data specifically for the federal state of Baden-Württemberg.
Data Manipulation Goals
- Select crop yield data: extract the annual yield data of spring barley, grain maize and winter wheat for Tübingen (nuts_id = DE142).
- Select climate data: extract the annual climate data for the variables mean air temperature, precipitation and ice days for Baden-Württemberg.
- Merge the datasets: create a tidy tibble (each row is one observation).
Visualization Goals
We want to investigate potential correlations between the crop yields and climate variables. The goal is to visualize how changes in climate variables such as mean air temperature, precipitation, and frost days may have influenced crop yields over the years. The tasks are arranged from highest to lowest priority, top to bottom.
Plot the crop yields against the climate variable:
Firstly, we want to explore the relationship between crop yields and specific climate variables to identify any potential correlations.
- Use faceting to create separate plots for each climate variable, arranged in vertical panels.
- Create scatter plots with the yields (t/ha) of the three crops on the y-axis and the respective climate variable on the x-axis.
- Include regression lines for each crop to show a trend.
- Add titles to each plot indicating the climate variable being analyzed.
- Color the points and regression lines by crop type.
- Include labels for the axes, including the units of measurement.
- Add a legend to indicate the crop type.
- Can you see any correlations between crop yields and the climate variables? Do the crops respond differently to changes in the climate variables? Are some crops more sensitive or better adapted to particular extreme conditions?
Create time plots of crop yields and climate variables:
Next, we want to visualize potential correlations between crop yields and climate variables over time.
- Use faceting again to create separate timeline scatter plots for each variable: one for each climate variable and one for the yield of each crop type, arranged in vertical panels.
- For each panel, plot the years on the x-axis and the respective climate variable or crop yield on the y-axis.
- Standardize the y-axis of each plot using the scale() function.
- Connect the scatter points with smooth, curved lines.
- Color the lines and dots green for positive values (above average) and orange for negative values (below average).
- Add titles and axis labels to each plot.
- Do you notice any patterns or correlations over time between climate variable and crop yield fluctuations? Do the crops behave differently in response to changes in the climate variables? Are the findings consistent with the first visualization?