Getting Started with GitHub Copilot
Where Do We Need AI Support?
Figure 1

Figure 2

Figure 3

Risks, Drawbacks and Responsibilities with AI Usage
Figure 1
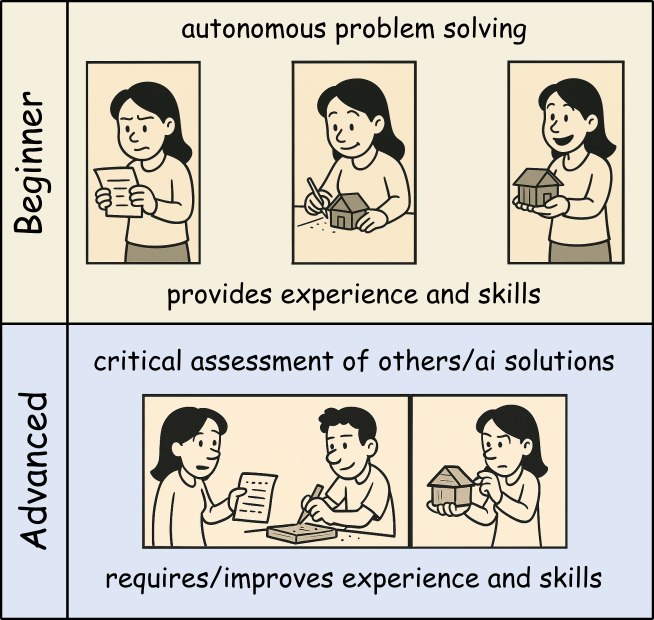
The image depicts the different tasks when
solving problems yourself or with the help of an AI assistant.
Figure 2

Education is what remains when you have no tool
at hand…
RStudio Autocompletion with Copilot
Figure 1
Context Definition and the AGENTS.md Concept
Using AI within Pipelines via ellmer
Understanding and Setting LLM Parameters
Figure 1
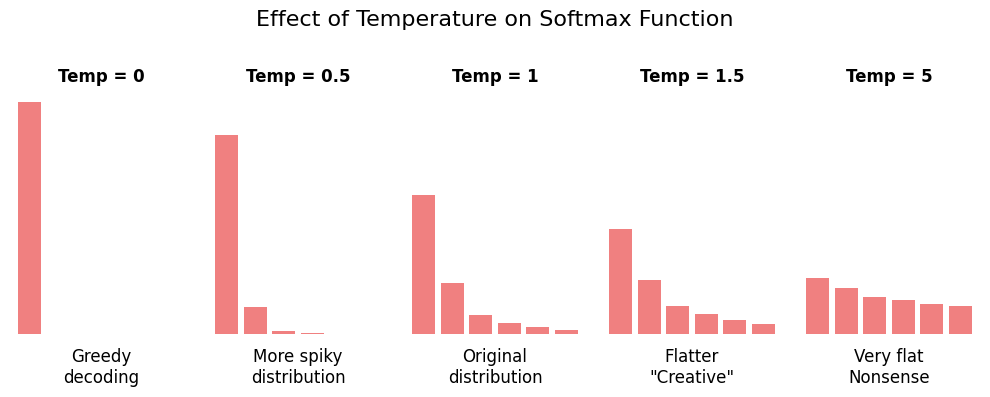
A graph showing probability distributions for
token selection with different temperature values. The left bar chart
shows low temperature, which causes a sharp peak on the highest
probability token. The middle chart shows temperature 1.0 with a
moderate distribution close to the values of the underlying
probabilities. The right chart shows high temperature usage, which
results in probabilities more evenly spread across tokens. This
demonstrates how lower temperatures concentrate probability on likely
tokens while higher temperatures distribute probability more evenly.
(Source: Soso Sukhitashvili, GenAI_parameters_temperature_topK_topP)
Figure 2
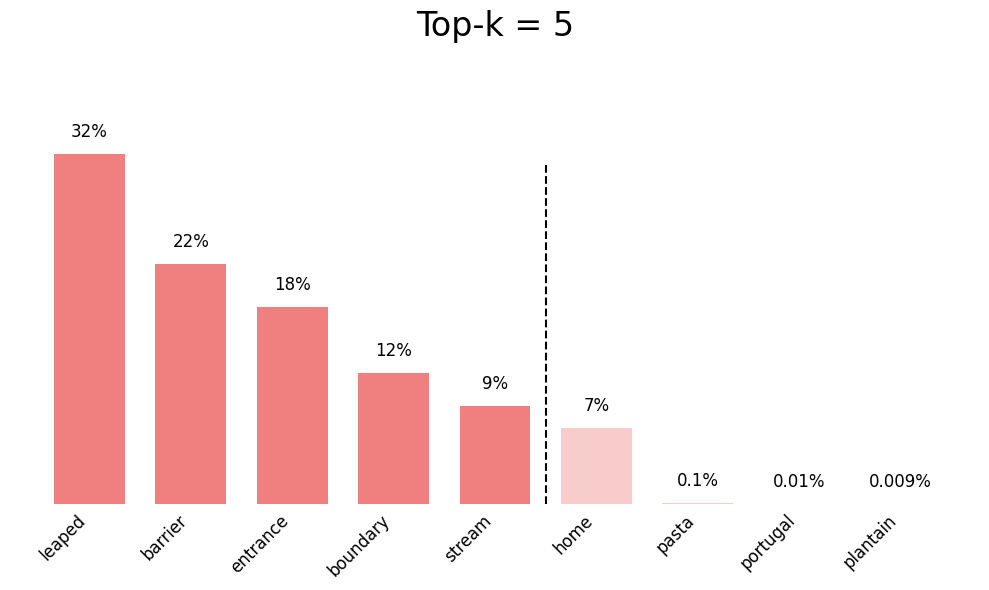
A diagram showing how top-K sampling works,
i.e. how top-K limits the selection pool by keeping only the K
most probable tokens. (Source: Soso Sukhitashvili, GenAI_parameters_temperature_topK_topP)
Figure 3
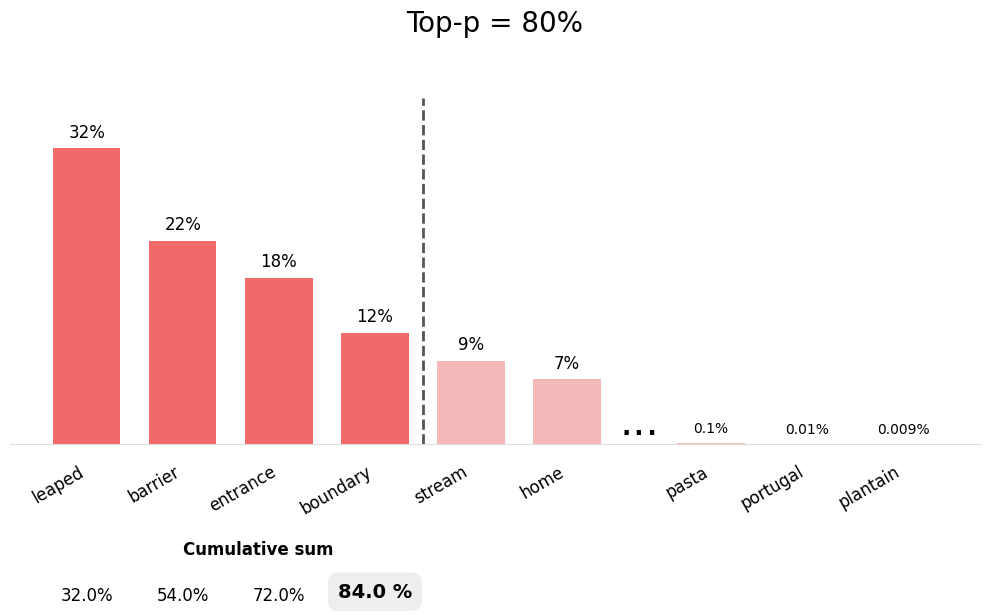
A diagram illustrating top-P (nucleus) sampling
where the parameter is used to dynamically adjust the number of
candidate tokens based on the cumulative probability threshold. (Source:
Soso Sukhitashvili, GenAI_parameters_temperature_topK_topP)
Revise Your Code with AI
Figure 1
GitHub Issue-Driven Coding with Copilot
Figure 1